For any mid-size retailer, it’s useful to track the overall performance of all stores across paid and free listings. However, the most value comes out of understanding the traffic received by each specific location - this helps you get insights of the trends in each region and proactively take actions to boost performance and drive footfall.
What's new?
We’ve just released a new graph available on the chain dashboard (MyShop), designed to offer richer insights for retailers with more than 1 location!
The graph displays your top performing locations in the last 30 days. Use the toggle at the top of the graph to switch between impressions and clicks. If you have Local Ads enabled, you will be able to see the traffic generated through the ads compared to the free local listings. Scroll down to “My Locations” to see the performance trends for each location and change your Local Ads plan if needed!
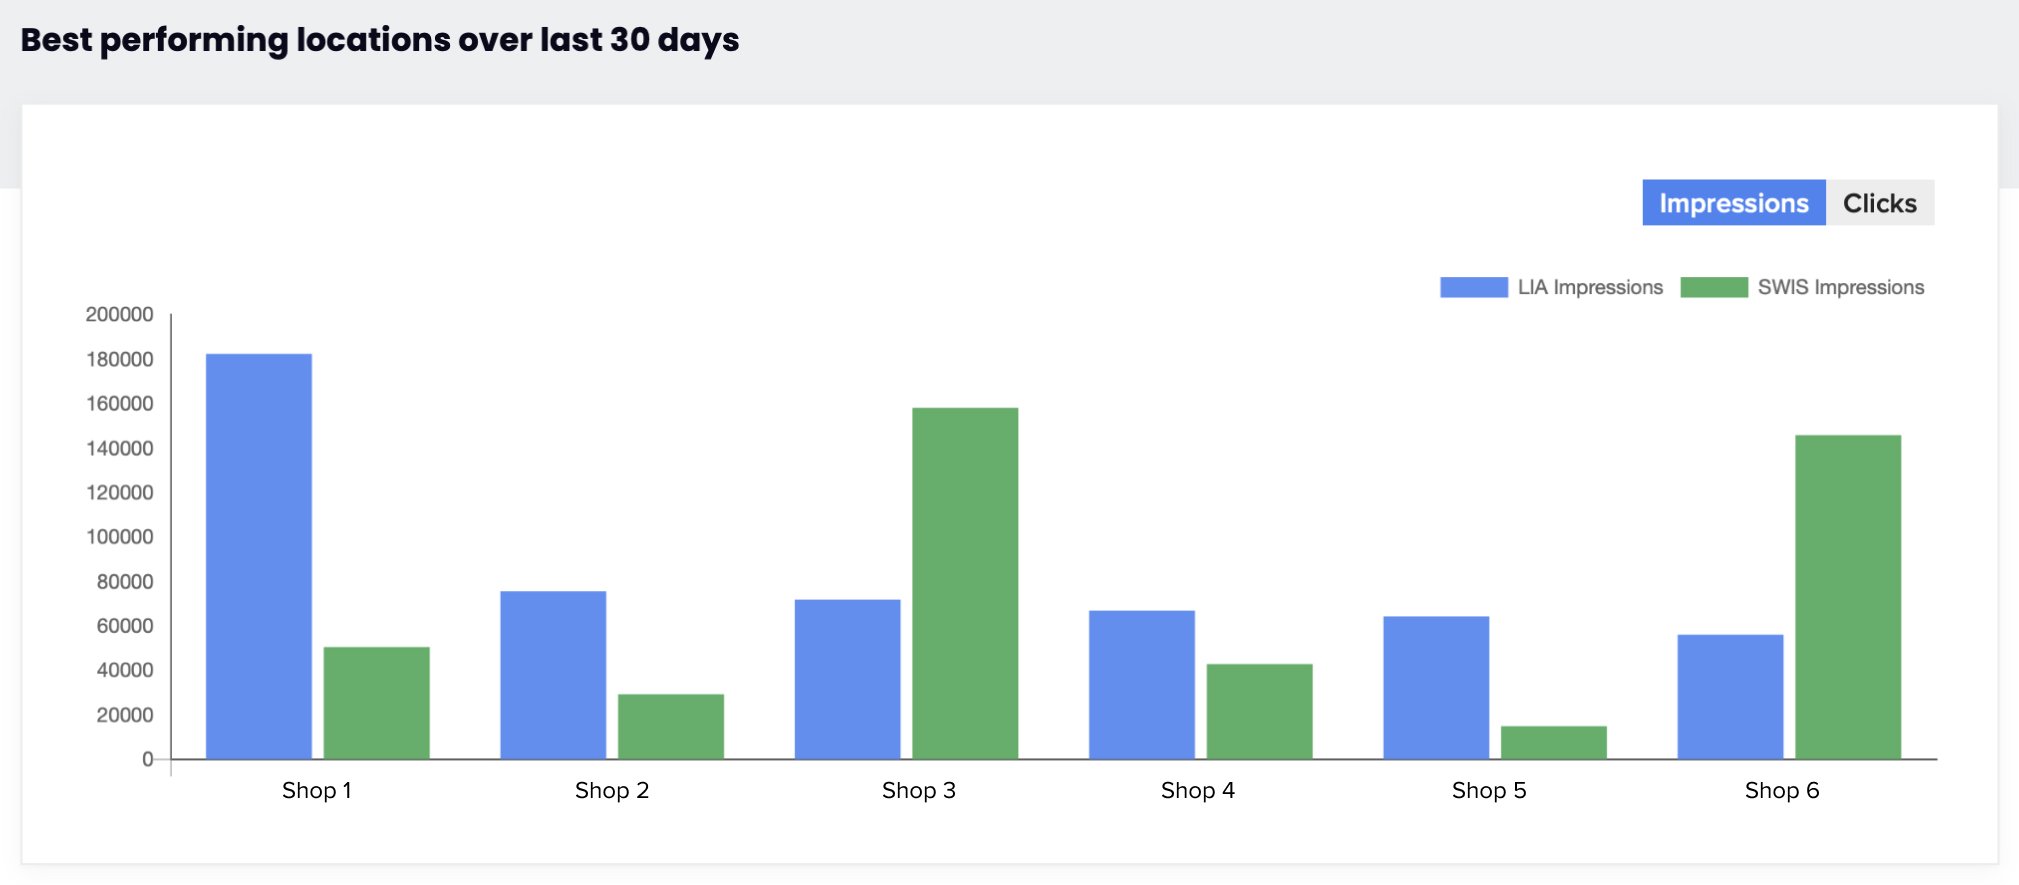
You can use this data to manage your marketing budget per each location. Experiment with different ads budgets depending on regions. For example, a store located in a highly populated area will require a higher ad budget to bid for clicks, as it’s competing against more retailers. Shift your ad budget as needed and come back in a week to track the results!
Remember, your Customer Success contact is always on hand to advise you!
What steps can you take to improve the performance of a location?
- If your ad budget is higher for one location, but it’s generating less impressions/clicks than others - have a look at where the stores are located. You might need to allocate more budget to stores located in busy areas to bid against your competitors!
- If you don’t have ads enabled and you would like to increase your local listing impressions - we suggest looking at the Local ads subscription page to discover the estimated impact of each plan. You can also contact your Customer Success Executive to get a recommendation of where to start!
- If you want to boost product clicks for a specific location to drive more traffic - we recommend exploring the insights available in MyShop to understand the performance for that store over time. Go to the Local Ads tab in your Insights section and use the date picker to select “last 3 months”. Based on the maximum traffic range, determine whether you need to increase your plan. Another option is to talk to your Customer Success Executive about optimising your ads.
What's next?
We’re currently working on bringing even more value to your MyShop dashboard, including key insights that demonstrate the impact of your online presence.
For mid-size retailers, we will be adding a date range filter that will allow you to compare location performance over any period of time! Moreover, we will also enable you to select specific locations to track in the graph.
If you have any questions, please contact your Customer Success Executive, or email support@near.st and we’ll be happy to help!
